


Greenwich (East London)
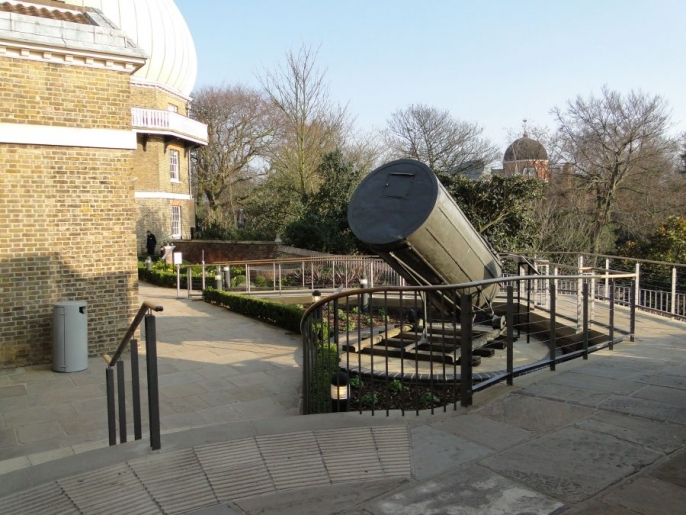
The earliest source of regular weather data from Greater London was from the Royal Observatory at Greenwich. Daily observations were undertaken from 1841 until the 1990s. The photograph (taken in 2011) shows the area, originally grassed, where temperature and rainfall readings were made daily for decades.
| Av. Max | Av. Min | Ext. Max | Ext. Min |
Rainfall | Wettest | Rain Days |
Frost | |
|
January |
7 |
2 |
15 |
-12 |
51 |
41 |
17 |
5 |
|
February |
7 |
2 |
20 |
-13 |
38 |
20 |
13 |
6 |
|
March |
11 |
3 |
22 |
-6 |
36 |
28 |
11 |
3 |
|
April |
13 |
4 |
29 |
-5 |
46 |
18 |
14 |
2 |
|
May |
17 |
7 |
33 |
-2 |
46 |
25 |
13 |
0.2 |
|
June |
21 |
11 |
34 |
2 |
41 |
41 |
11 |
0 |
|
July |
23 |
13 |
35 |
7 |
51 |
36 |
13 |
0 |
|
August |
22 |
12 |
37 |
4 |
56 |
56 |
13 |
0 |
|
September |
19 |
11 |
34 |
1 |
46 |
33 |
13 |
0 |
|
October |
14 |
7 |
29 |
-5 |
58 |
41 |
14 |
2 |
|
November |
9 |
4 |
20 |
-8 |
63 |
35 |
16 |
7 |
|
December |
7 |
2 |
16 |
-13 |
51 |
28 |
16 |
6 |
|
Year |
14 |
6 |
37 |
-13 |
582 |
56 |
164 |
31 |